
Average miles driven per year by state

What is the average number of miles driven per year? The short answer is: 13,476, according to the U.S. Department of Transportation Federal Highway Administration (FHWA). Put another way, the average driver racks up over 1,000 miles each month, or almost the equivalent of two roundtrips from New York City to Los Angeles.
But to understand driving habits nationwide, you need to look at who is driving how much and where. FHWA and other federal research data underscore the following trends:
Most states are seeing motorists drive more miles: Nearly 70 percent of states recorded an increase in vehicle miles traveled. Oregon is tops for the highest increase (16 percent) over the three-year period from 2011 to 2014.
Men drive more miles than women: The average male driver logs 16,550 miles a year – 63 percent more than the average for women, 10,142.
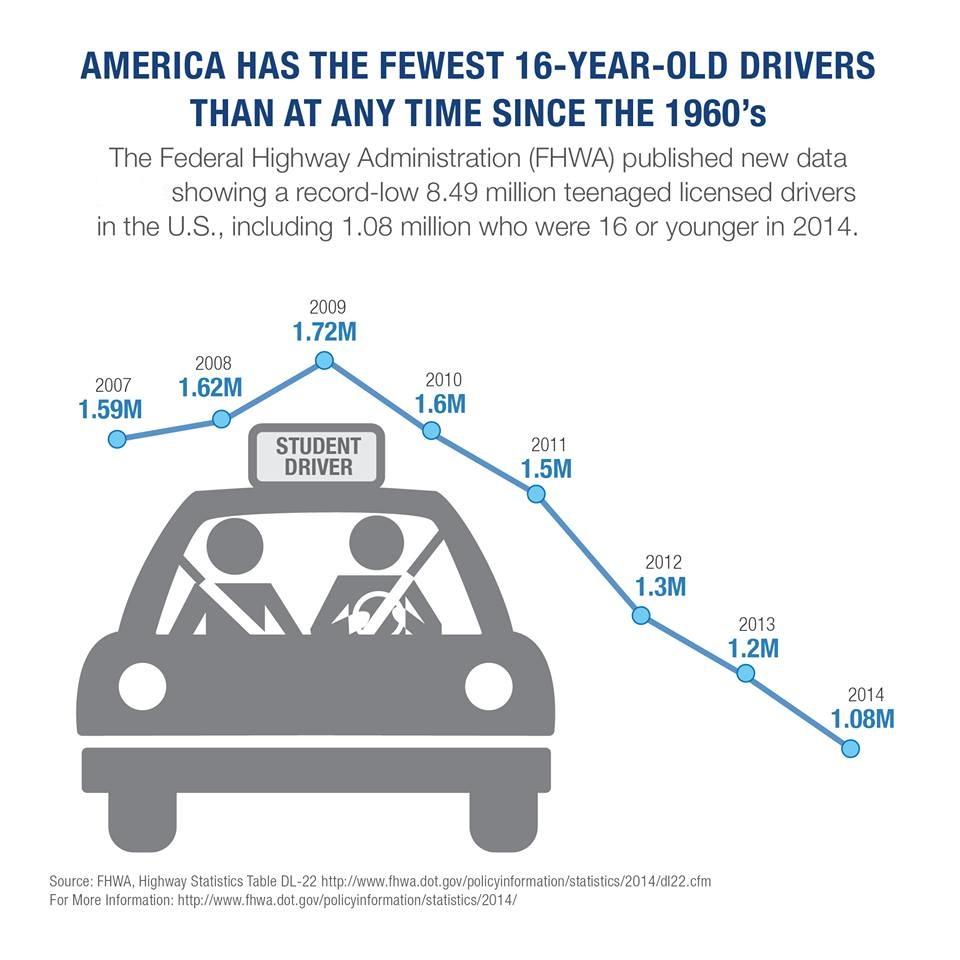
Fewer teens are getting licenses: The number of teens with drivers’ licenses has dipped significantly since the 1980s – from 46 percent to 24 percent – for drivers aged 16.
Senior drivers are staying on the road longer: Motorists over age 65 are driving more miles and keeping their licenses longer, and drivers over 85 comprise the fastest growing age group -- and the trend is projected to continue.
Miles per capita by state show motorists driving more
The majority of states, nearly 70 percent, saw an increase in vehicle miles traveled (VMT) per capita from 2011 to 2014, according to FHWA data. VMT per capita is calculated by taking the total annual miles of vehicle traveled divided by the total population of the state. The national average for VMT per capita averaged 9,455 in 2011 and was up to 9,772 in 2014.
The uptick in driving is not spread evenly among the states. Some states are seeing a much bigger increase than others and almost a third are in decline. The mileage you drive affects your insurance rates, because companies figure the more you drive, the higher your risk of being in an accident. Therefore, state car insurance rates may be generally affected by these trends.
Oregon was the big winner when it comes to VMT per capita with a 19 percent increase. Alaska and Georgia are tied for second with a 16 percent increase, Texas was No. 3 at 14 percent and West Virginia came in fourth with a 12 percent bump.
A number of states are still in decline when it comes to VMT per capita. North Dakota managed to shave 16 percent off their VMT numbers to claim the top spot. Louisiana was No. 2 with a 10 percent decline with Montana and Alabama tied for third place with a 6 percent drop.
You’ll see in the chart below we calculated the percent change in VMT for each state, based on FHWA data:
| State | 2011 Miles per capita | 2014 Miles per capita | Change | % Change |
| Alabama | 13,516 | 12,713 | -803 | -6% |
| Alaska | 6,355 | 7,369 | 1,014 | 16% |
| Arizona | 9,190 | 9,701 | 511 | 6% |
| Arkansas | 11,216 | 10,912 | -304 | -3% |
| California | 8,511 | 9,053 | 542 | 6% |
| Colorado | 9,108 | 9,712 | 604 | 7% |
| Connecticut | 8,713 | 9,033 | 320 | 4% |
| D.C. | 5,774 | 6,115 | 341 | 6% |
| Delaware | 9,952 | 10,524 | 572 | 6% |
| Florida | 10,067 | 9,519 | -548 | -5% |
| Georgia | 11,050 | 12,828 | 1,778 | 16% |
| Hawaii | 7,322 | 7,055 | -267 | -4% |
| Idaho | 10,055 | 10,467 | 412 | 4% |
| Illinois | 8,022 | 8,283 | 261 | 3% |
| Indiana | 11,736 | 11,655 | -81 | -1% |
| Iowa | 10,213 | 10,059 | -154 | -2% |
| Kansas | 10,456 | 10,465 | 9 | 0% |
| Kentucky | 11,000 | 11,582 | 582 | 5% |
| Louisiana | 10,167 | 9,143 | -1,024 | -10% |
| Maine | 10,727 | 11,138 | 411 | 4% |
| Maryland | 9,646 | 9,474 | -172 | -2% |
| Massachusetts | 8,318 | 8,316 | -2 | 0% |
| Michigan | 9,594 | 9,840 | 246 | 3% |
| Minnesota | 10,606 | 10,693 | 87 | 1% |
| Mississippi | 13,044 | 12,495 | -549 | -4% |
| Missouri | 11,444 | 11,990 | 546 | 5% |
| Montana | 11,681 | 10,956 | -725 | -6% |
| Nebraska | 10,362 | 10,568 | 206 | 2% |
| Nevada | 8,882 | 8,828 | -54 | -1% |
| New Hampshire | 9,650 | 9,734 | 84 | 1% |
| New Jersey | 8,286 | 8,016 | -270 | -3% |
| New Mexico | 12,262 | 12,512 | 250 | 2% |
| New York | 6,562 | 6,801 | 239 | 4% |
| North Carolina | 10,746 | 11,120 | 374 | 3% |
| North Dakota | 13,351 | 11,241 | -2,110 | -16% |
| Ohio | 9,700 | 9,328 | -372 | -4% |
| Oklahoma | 12,519 | 12,567 | 48 | 0% |
| Oregon | 8,619 | 10,234 | 1,615 | 19% |
| Pennsylvania | 7,785 | 8,333 | 548 | 7% |
| Rhode Island | 7,515 | 7,976 | 461 | 6% |
| South Carolina | 10,414 | 11,350 | 936 | 9% |
| South Dakota | 10,924 | 11,183 | 259 | 2% |
| Tennessee | 11,049 | 11,554 | 505 | 5% |
| Texas | 9,248 | 10,554 | 1,306 | 14% |
| Utah | 9,308 | 10,120 | 812 | 9% |
| Vermont | 11,399 | 11,202 | -197 | -2% |
| Virginia | 10,001 | 10,568 | 567 | 6% |
| Washington | 8,339 | 9,048 | 709 | 9% |
| West Virginia | 10,221 | 10,643 | 422 | 4% |
| Wisconsin | 9,525 | 10,678 | 1,153 | 12% |
| Wyoming | 16,272 | 16,410 | 138 | 1% |
Vehicle miles driven per licensed driver by state
You’ll see in the chart below how states rank for miles by driver for each state, according to the FHWA. Wyoming leads in this category with 21,821, while Alaska has fewest miles per licensed driver at 9,915.
| State | Registered vehicles | Total licensed drivers | Licensed drivers per 1,000 driving age population | Vehicle miles per licensed driver |
| AL | 3,960,149 | 3,521,444 | 1,020 | 16,054 |
| AK | 594,399 | 465,256 | 1,016 | 9,915 |
| AZ | 3,794,538 | 3,433,995 | 879 | 14,493 |
| AR | 1,840,193 | 1,947,867 | 940 | 14,974 |
| CA | 27,697,923 | 21,243,939 | 830 | 14,435 |
| CO | 3,626,012 | 3,107,258 | 935 | 13,443 |
| CT | 2,853,449 | 2,652,593 | 1,001 | 11,595 |
| DE | 630,446 | 556,688 | 913 | 14,802 |
| DC | 242,081 | 348,216 | 742 | 10,045 |
| FL | 11,781,010 | 12,853,428 | 1,009 | 11,836 |
| GA | 7,155,006 | 5,550,176 | 888 | 18,920 |
| HI | 737,551 | 769,383 | 811 | 11,104 |
| ID | 1,177,700 | 883,546 | 912 | 15,318 |
| IL | 8,972,584 | 7,961,046 | 835 | 12,921 |
| IN | 5,570,942 | 3,976,241 | 849 | 17,821 |
| IA | 3,106,223 | 1,952,508 | 856 | 15,074 |
| KS | 2,296,135 | 1,908,117 | 927 | 14,742 |
| KY | 2,826,403 | 2,694,469 | 852 | 17,370 |
| LA | 3,556,982 | 2,759,120 | 813 | 14,805 |
| ME | 1,024,096 | 920,235 | 911 | 15,420 |
| MD | 3,847,538 | 3,382,451 | 828 | 14,834 |
| MA | 5,265,399 | 4,489,695 | 897 | 11,759 |
| MI | 8,435,721 | 6,925,246 | 908 | 14,121 |
| MN | 4,629,940 | 2,940,789 | 777 | 17,887 |
| MS | 2,289,411 | 2,007,746 | 930 | 17,699 |
| MO | 4,579,629 | 3,856,271 | 898 | 17,396 |
| MT | 1,026,226 | 678,899 | 968 | 14,556 |
| NE | 1,618,933 | 1,195,219 | 909 | 15,128 |
| NV | 1,219,725 | 1,370,643 | 891 | 12,869 |
| NH | 1,051,751 | 929,630 | 967 | 12,931 |
| NJ | 6,390,031 | 5,654,973 | 864 | 11,927 |
| NM | 1,528,510 | 1,239,043 | 904 | 18,369 |
| NY | 10,234,531 | 10,871,344 | 735 | 11,871 |
| NC | 6,222,503 | 5,690,494 | 905 | 15,729 |
| ND | 693,860 | 458,944 | 914 | 15,725 |
| OH | 10,467,476 | 8,205,524 | 934 | 12,906 |
| OK | 3,014,491 | 2,295,036 | 861 | 18,891 |
| OR | 3,021,574 | 2,495,059 | 933 | 14,032 |
| PA | 9,259,967 | 8,229,490 | 849 | 12,435 |
| RI | 759,570 | 654,035 | 791 | 12,781 |
| SC | 3,094,729 | 2,842,553 | 913 | 16,020 |
| SD | 792,509 | 543,817 | 942 | 15,505 |
| TN | 4,819,799 | 4,251,228 | 956 | 15,462 |
| TX | 14,070,096 | 13,462,023 | 862 | 16,347 |
| UT | 1,627,606 | 1,463,366 | 915 | 15,442 |
| VT | 514,883 | 506,085 | 1,057 | 13,458 |
| VA | 6,046,127 | 4,836,993 | 875 | 15,464 |
| WA | 5,115,866 | 4,154,501 | 912 | 12,837 |
| WV | 1,441,735 | 1,347,207 | 926 | 14,283 |
| WI | 4,365,525 | 3,770,453 | 907 | 15,188 |
| WY | 585,690 | 370,740 | 971 | 21,821 |
| All of U.S. | 221,475,173 | 190,625,023 | 878 | 14,425 |
Average annual miles driven by age group
Here is how many miles people drive, broken down by age group, per year, according to fe deral data:
- Age 16 to 19 – 7,624
- Age 20 to 34 – 15,098
- Age 35 to 45 – 15,291
- Age 55 to 64 – 11,972
- Over age 65 – 7,646
While middle-aged drivers log the most miles, it’s interesting to note that senior motorists as a group have been driving a lot more since 1990. The trend is expected to continue to 2040, according to the U.S. Energy Information Agency (EIA).
Drivers over 85 comprise the fastest growing sector of motorists, reports the FHWA.
Data from the FHWA show:
- Drivers over 50 years old reached nearly 93.5 million in 2013 – an increase of 22 percent since 2003 – resulting in 44 percent of total licensed drivers.
- Drivers over 85 years old remain the fastest growing demographic group, nearly doubling from 1.76 million in 1998 to 3.48 million in 2013 – the second-highest amount ever recorded.
- Drivers age 60 and older represented almost 26 percent of all licensed drivers in 2014, up from 20 percent in 2004.
On the other hand, teens are driving less and fewer are getting licenses. The number of licensed teen drivers is at its lowest ever, and drivers age 16 are down significantly, according to the FHWA. Of the 8.5 million teen drivers with a license in 2014, just about 1 million were age 16.
Other key data show:
- Total vehicle miles driven by teen drivers have plummeted, not only because a smaller share of them are driving but also because miles per young driver have also declined.
- In 1990, each driver aged 16 to 19 drove an average of 8,485 miles per year. That compares to 6, 244 in 2009, according to the Fuels Institute “Driver Demographics” report.
- The share of 17-year-olds with driver's licenses dipped to 45 percent in 2014, from 54 percent in 2001, according to the Policy and Governmental Affairs Office of Highway Policy Information data. As you’ll see in the chart below, the trend holds for other teen drivers.
| Driver age | 2001: Drivers as % of age group | 2014: Drivers as % of age group |
| 16 | 34% | 25% |
| 17 | 54% | 45% |
| 18 | 68% | 60% |
| 19 | 75% | 69% |
| Age 16 to 19 | 47% | 40% |
How do you compare?
If you’re not sure how many miles you drive per year, use the chart below to find out. Track your travels to see if you qualify for a low-mileage discount, as well as for your tax records if you will be claiming mileage as a deduction for business, medical, moving or charitable purposes.
Yearly mileage conversion table
| Miles you drive in a typical day | Miles you drive in a typical week | Estimated yearly miles |
| 3 | 21 | 2,000 |
| 6 | 42 | 3,000 |
| 9 | 63 | 4,000 |
| 11 | 77 | 5,000 |
| 14 | 98 | 6,000 |
| 17 | 119 | 7,000 |
| 20 | 140 | 8,000 |
| 22 | 154 | 9,000 |
| 25 | 175 | 10,000 |
| 28 | 196 | 11,000 |
| 31 | 217 | 12,000 |
| 33 | 231 | 13,000 |
| 36 | 252 | 14,000 |
| 39 | 273 | 15,000 |
| 42 | 294 | 16,000 |
| 44 | 308 | 17,000 |
| 47 | 329 | 18,000 |
| 50 | 350 | 19,000 |
| 53 | 371 | 20,000 |
| 55 | 385 | 21,000 |
How to get a low-mileage discount
Any discount you get for low mileage depends largely on your insurance company, says CarInsurance.com consumer analyst Penny Gusner.
 "The discount is typically 5 to 15 percent, and at some companies the discounts start at 10,000 miles, and others at 7,500 miles," she says, noting that the discounts usually apply to collision and liability coverages so it's not a full 5 to 15 percent off your total bill. "You may not see a line item on your policy that says ‘low mileage discount’ because many companies adjust your base rates, so you may have to ask your agent or company to make sure your premium reflects any change."
Typically, a low-mileage discount translates into a savings on yourpolicy of up to 2 percent, depending on your insurer, but in some states it can be higher. In California, for example, you get a huge savings because mileage is chief among the factors insurers use to set rates. States with high savings from low-mileage discounts:
- California – 22% savings
- Massachusetts – 6% savings
- Wisconsin – 4% savings
- Pennsylvania – 3% savings
Some companies may require verification of your mileage. That could come from several sources: a form that you fill out; a photo you take and mail in; or service and emissions records.
If you drive an exceptionally small number of miles -- safely -- pay-as-you-drive insurance might save you even more. Insurers, such as Progressive, send you a device that plugs into your car and reports odometer readings and driving habits, then calculate a discount that can reach 40 percent in some rare cases.
The rise and fall of driving, and then rise
For roughly 60 years, the number of miles driven by Americans rose year after year, until 2004 when they topped out around 10,120 per capita.
Since then, the number of driving miles per capita was in decline in almost every state. In some states, it was a double-digit drop. Industry insiders, those that research driving trends for federal and private agencies such as auto clubs, referred to it as the end of the Driving Boom.
As driving miles dipped, so did accidents. According to data from the U.S. Department of Transportation, the number of fatalities out on the road held pretty steady around 42,000 to 45,000 from 1986 all the way up to 2008, and then things started to change.
In 2008, the number of fatalities dropped to 37,423 and then plunged to 33,883 in 2009. It has hovered around the 32,000 mark ever since, until 2015, when Americans decided to put 3.15 trillion miles on their vehicles. Apparently, the “Driving Boom” is back.
“Americans drove 3.1 trillion miles in 2015, which was an all-time record and 3.5 percent higher than in 2014,” says Julie Hall with AAA National Office. As we move into summer, the roads will be both crowded and dangerous.
AAA says 38 million Americans traveled over Memorial Day weekend, which is the second-highest volume for the holiday weekend ever and the most holiday drivers out on the road since 2005.
All of this new driving is leading to an increase in accidents. The National Highway Traffic Safety Administration (NHTSA) projects there were 26,000 fatalities in the first nine months of 2015, which is a 9.3 percent increase from 2014. The NHTSA reports that the third quarter of 2015 represents the fourth consecutive quarter that fatality rates have gone up.
Not all regions are created equal when it comes to fatalities out on the road. The Northwest region, which includes Washington, Oregon, Idaho and Montana saw a 20 percent increase in fatalities, the largest increase in the entire country.
Most experts expect the upward trend in miles driven to continue:
- New data released by the U.S. Department of Transportation show that U.S. driving reached 746 billion miles in the first three months of 2016, beating the previous record of 720.1 billion miles set last year.
- For a sense of scale, 746 billion miles is roughly 286.9 times as far as the International Space Station (ISS) has traveled since it began orbiting in 1998. In fact, Americans drive twice as far on any given day before noon as the ISS has ever flown.
- The seasonally-adjusted vehicle miles traveled for March 2016 were 268.2 billion miles, a new monthly record for seasonally-adjusted VMT.
What’s fueling the driving trend?
There is no definitive data on the reasons why motorists are driving more, but most experts feel that extremely low gas prices combined with an improving economy is largely responsible. “The great American road trip is back, largely due to cheaper gas prices,” says Hall.
AAA estimates that Americans have saved more than $18 billion on gas so far this year compared to the same period in 2015. Prices are at the lowest levels in 11 years.
Affordable gas is a big motivator when it comes to summer road trip planning. “Low gas prices increases travel, especially discretionary and long distance travel,” says David Levinson, CTS Chair in Transportation at the University of Minnesota.
A recent AAA survey found that 55 percent of Americans are more likely to take a road trip due to low gas prices.
Fatalities outpacing miles driven
While cheap gas is most likely responsible for the boom in driving numbers, fatality rates are shooting up much faster than the miles being driven rates, 3.5 percent versus a 9.5 percent increase in fatalities.
Young, inexperienced drivers may be the source of the large increase in fatality rates. Though some states rank better than others in terms of teen driver safety, young drivers as a group nationwide get into more accidents than other age groups.
According to Levinson, “The drivers who were priced off the system due to high gas prices and high unemployment were the marginal drivers, particularly younger drivers who had the least experience both in the workforce and behind the wheel. As young drivers enter the economy in greater numbers, crash rates go up.”
More research on teens spurning licensing
Despite cheap gas and an improving economy, teenagers are still not flocking to the roads in numbers seen in previous generations.
According to research done by Michael Sivak and Brandon Schoettle of the University of Michigan Transportation Research Institute, the number of 16-year olds with a driver’s license has decreased over the last three decades, from 46 percent to 24 percent.
Even if graduated licensing programs have pushed up the age of licensure, data shows that Millennials are just not as interested in driving. About 87 percent of 19-year-olds in 1983 had their licenses, but more than 30 years later, that percentage had dropped to 69 percent. Those age 18 with a license fell from 80 percent in 1983 to 60 percent in 2014, and 17-year-olds decreased from 69 percent to 45 percent.
The repercussions: Higher car insurance rates
More traffic almost always equals more accidents, as increasing fatality rates confirm. Unfortunately, an increasing number of accidents will eventually affect insurance rates.
“Insurers utilize a number of factors when calculating a premium; one of those would be loss data for a given geographical area, usually a ZIP code. A high rate of traffic collisions will result in a higher premium for that area. While a single-year spike in accident activity will not have an immediate impact on insurance rates, if the trend continues, your insurance premium will be headed up,” warns Kris Kristofer Kirchen, with Advanced Insurance Managers in Tampa.
That means that even with a clean driving record and discounts, the cost of your car insurance may go up. Rates for the same coverage vary significantly among insurers because they each use their own formula to calculate what you pay. You can save hundreds of dollars by switching to a company offering a lower rate. In addition to seeing if you qualify for a low-mileage discount, compare pricing by using our average car insurance rates tool to see what you can expect to pay in your neighborhood.